 八零岁月
八零岁月
一、环境信息以及安装前准备
主机信息(内存尽可能大点)

软件版本
部署前操作
关闭防火墙selinux等,开机自启关掉
同步时间服务器
[root@hk-elk-elastic5 java]# systemctl stop firewalld
[root@hk-elk-elastic5 java]# systemctl disable firewalld.service
[root@hk-elk-elastic5 java]# crontab -l
0 */8 * * *  /usr/sbin/ntpdate 10.20.1.1;/sbin/hwclock -w
二、redis启动
具体查看官网redis的启动和配置
三、elasticsearch集群安装配置
1、elk安装需要java环境以及创建elk用户
[root@hk-elk-elastic1 java]# rpm -ivh jdk-8u181-linux-x64.rpm
[root@hk-elk-elastic1 java]# vim /etc/profile    #配置java环境变量JAVA_HOME=/usr/java/jdk1.8.0_181amd64
CLASSPATH=.:$JAVA_HOME/lib/dt.jar:$JAVA_HOME/lib/tools.jar
PATH=$JAVA_HOME/bin:$PATH
export PATH JAVA_HOME CLASSPATH
[root@hk-elk-elastic1 ~]# groupadd elastic
[root@hk-elk-elastic1 ~]# useradd -g elastic elastic
[root@hk-elk-elastic1 ~]# chown elastic:elastic /usr/local/elk -R  #给目录相关权限[root@hk-elk-elastic1 ~]# chown elastic:elastic /data -R
[root@hk-elk-elastic1 ~]# mkdir /data/log -p  #创建data数据目录,以及log日志目录
[root@hk-elk-elastic1 java]# sudo -u elastic java -version  #用elastic查看是有有java权限java version "1.8.0_181"
Java(TM) SE Runtime Environment (build 1.8.0_181-b13)
Java HotSpot(TM) 64-Bit Server VM (build 25.181-b13, mixed mode)
2、安装以及配置elasticsearch(master)
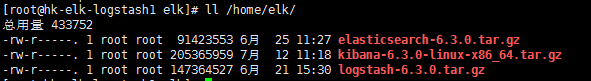
[root@hk-elk-elastic1 java]# cd /usr/local/elk/
[root@hk-elk-elastic1 elk]# tar -xf elasticsearch-6.3.0.tar.gz
##配置elasticsearch内存,最大不能超过32G,最好配置系统内存的一半
[root@hk-elk-elastic1 elk]# vim elasticsearch-6.3.0/config/jvm.options
-Xms8g
-Xmx8g
[root@hk-elk-elastic1 elk]# grep "^[a-z]" elasticsearch-6.3.0/config/elasticsearch.yml
cluster.name: hk-elk-application    #集群名称
node.name: hk-elk-master1    #节点名  ##master2、master3只有此处的节点名不同,其余配置均一样node.master: true    #担任master选举
node.data: false    #不作为data存储数据
path.data: /data    #data目录
path.logs: /data/log    #日志目录
network.host: 10.20.11.205        #监听ip
http.port: 9200    #监听端口
transport.tcp.port: 9300    #通信端口
discovery.zen.ping.unicast.hosts["10.20.11.205:9300","10.20.11.206:9300","10.20.11.207:9300"]    #master主机通信端口
discovery.zen.minimum_master_nodes: 2    #这个值为(master/2)+1,防止集群脑裂discovery.zen.ping_timeout: 60s    #master之间的通信时间,考虑到网络因数,设置为60s
安装以及配置elasticsearch(data)
[root@hk-elk-elastic4 elk]# grep "^[a-z]" elasticsearch-6.3.0/config/elasticsearch.yml
cluster.name: hk-elk-application
node.name: hk-elk-data2  #节点名  ##data2只有此处节点名不同,其余配置均一样
node.master: false  #不担任master选举
node.data: true  #担任数据节点
path.data: /data
path.logs: /data/log
network.host: 10.20.11.209
http.port: 9200
transport.tcp.port: 9300
discovery.zen.ping.unicast.hosts["10.20.11.205:9300","10.20.11.206:9300","10.20.11.207:9300"]
设置打开文件描述符、进程数、内存限制,以及内核参数
[root@hk-elk-elastic1 elk]# vim /etc/security/limits.conf
*       soft    nofile  65536
*       hard    nofile  65536
*      soft    memlock unlimited
*      hard    memlock unlimited
[root@hk-elk-elastic1 elk]# vim /etc/security/limits.d/20-nproc.conf
*          soft    nproc     20480
root       soft    nproc     unlimited
[root@hk-elk-elastic1 elk]# vim /etc/sysctl.conf
vm.max_map_count=655360
net.ipv6.conf.all.disable_ipv6 = 1
net.ipv6.conf.default.disable_ipv6 = 1
[root@hk-elk-elastic1 elk]# systemctl -p  #使用此命令,可使配置立即生效
启动elasticsearch服务
[root@hk-elk-elastic1 elk]# cat /root/elastic.sh
sudo -u elastic /usr/local/elk/elasticsearch-6.3.0/bin/elasticsearch -d &&tailf /data/log/hk-elk-application.log
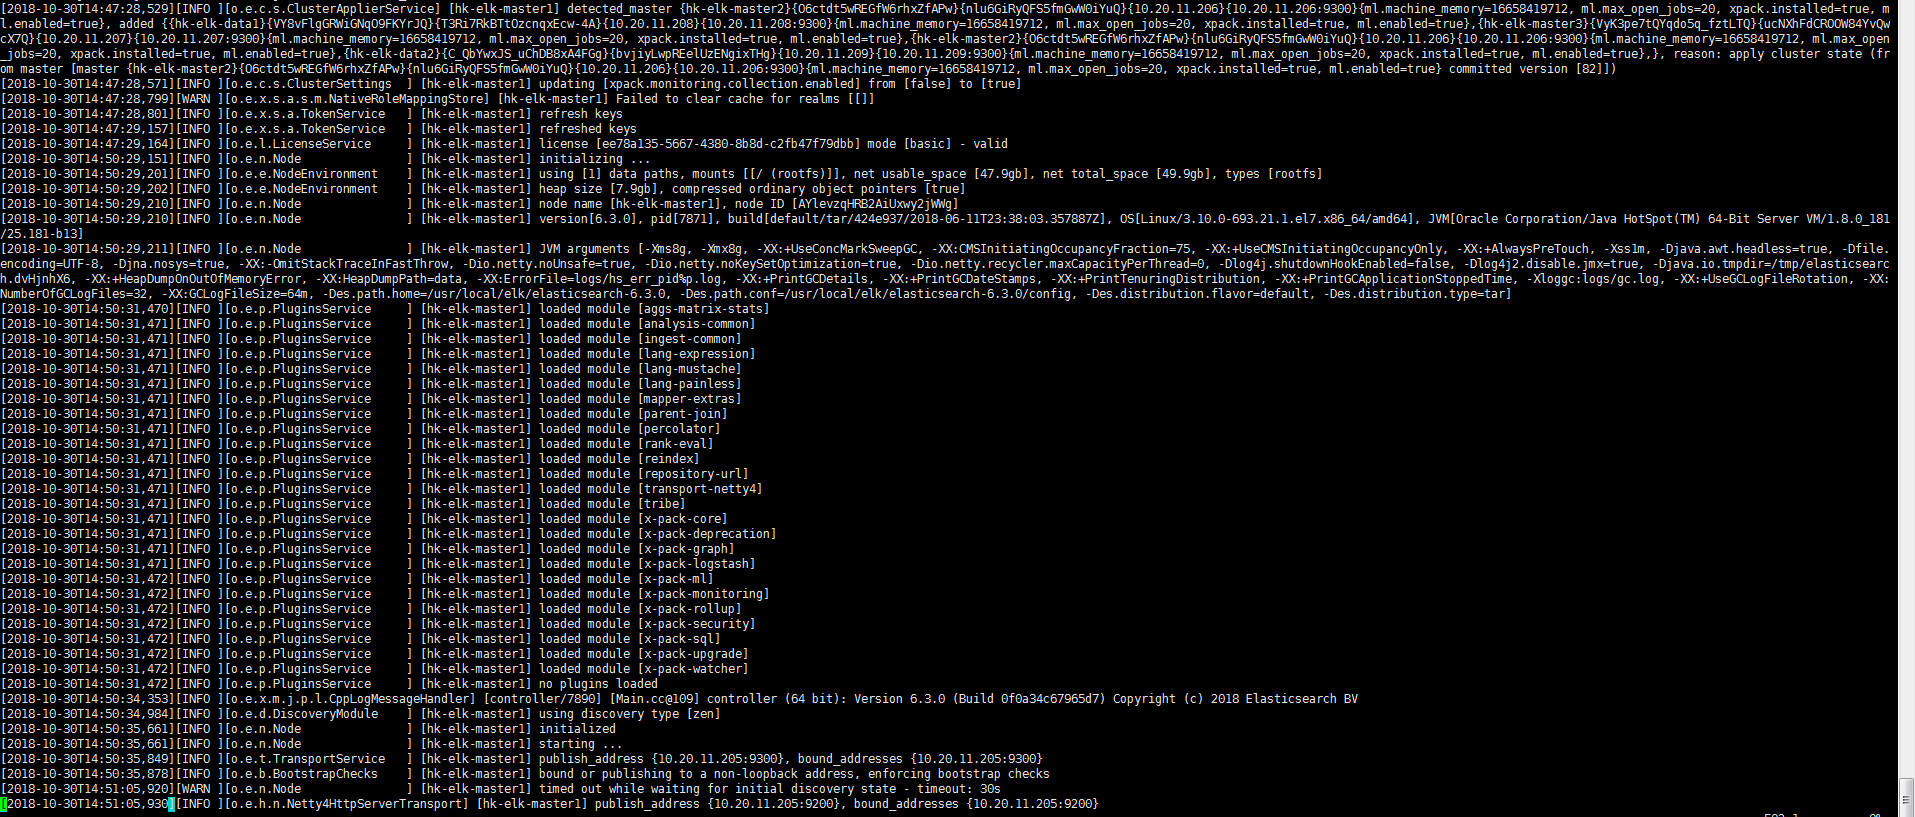
通过屏幕输出看到服务启动并通过自动发现的模式,将其他节点添加进来,我们可以查看集群状态
[root@hk-elk-elastic1 elk]# curl -u  http://10.20.11.205:9200/_cat/health?v
集群名称      状态    总数    data数
epoch      timestamp cluster            status node.total node.data shards pri relo init unassign pending_tasks max_task_wait_time active_shards_percent
1540902792 20:33:12  hk-elk-application green           5         2     30  15    0    0        0             0                  -                100.0%
[root@hk-elk-elastic1 elk]# curl -u http://10.20.11.205:9200/_cat/nodes?v
ip           heap.percent ram.percent cpu load_1m load_5m load_15m node.role master name
10.20.11.205            4          65   0    0.00    0.01     0.05 mi        *      hk-elk-master1  ##该节点被选举为master
10.20.11.207            3          63   0    0.00    0.01     0.05 mi        -      hk-elk-master3
10.20.11.209            7          63   0    0.00    0.01     0.05 di        -      hk-elk-data2
10.20.11.208            8          63   0    0.00    0.03     0.05 di        -      hk-elk-data1
10.20.11.206            4          63   0    0.00    0.01     0.05 mi        -      hk-elk-master2
四、安装配置kibana
[root@hk-elk-kibana elk]# tar -xf kibana-6.3.0-linux-x86_64.tar.gz ^C
[root@hk-elk-kibana elk]# grep "^[a-z]" kibana-6.3.0-linux-x86_64/config/kibana.yml
server.port: 5601  #端口
server.host: "10.20.11.215"  #监听ip
elasticsearch.url: "http://10.20.11.205:9200"  #elasticsearch机器ip以及端口
[root@hk-elk-kibana elk]# cat /root/kibana.sh   #启动脚本
#!/bin/bash
/usr/local/elk/kibana-6.3.0-linux-x86_64/bin/kibana > /dev/null 2>&1 &
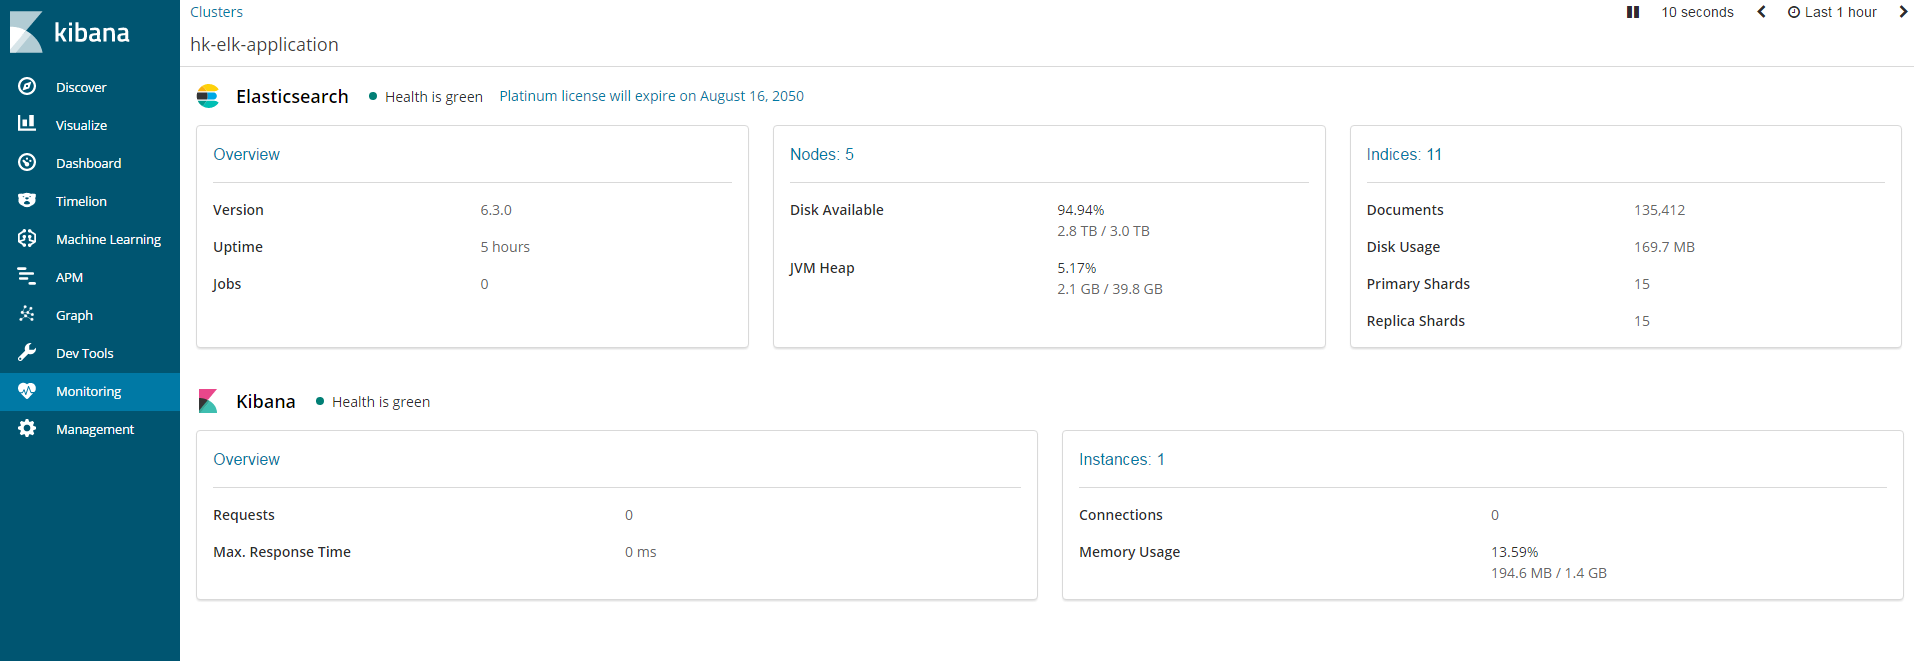
可以看的到elasticsearch集群的相关主机信息等
五*、破解x-pack插件(#只供学习使用)*
由于在elasticsearch在6.3版本之后x-pack是默认安装好的,所以不再需要用户自己去安装
1、生成新的x-pack-core-6.3.0.jar包,替换原有的项目包
[root@hk-elk-elastic1 elk]# vim LicenseVerifier.java
package org.elasticsearch.license;
import java.nio.*; import java.util.*;
import java.security.*;
import org.elasticsearch.common.xcontent.*;
import org.apache.lucene.util.*;
import org.elasticsearch.common.io.*;
import java.io.*;

public class LicenseVerifier {
    public static boolean verifyLicense(final License license, final byte[] encryptedPublicKeyData) {
        return true;
    }

    public static boolean verifyLicense(final License license)     {
        return true;
    }
}
[root@hk-elk-elastic1 elk]# vim XPackBuild.java
package org.elasticsearch.xpack.core;
import org.elasticsearch.common.io.*;
 import java.net.*;
 import org.elasticsearch.common.*;
 import java.nio.file.*;
 import java.io.*;
 import java.util.jar.*;
 public class XPackBuild {
    public static final XPackBuild CURRENT;
    private String shortHash;
    private String date;
    @SuppressForbidden(reason = "looks up path of xpack.jar directly") static Path getElasticsearchCodebase() {
        final URL url = XPackBuild.class.getProtectionDomain().getCodeSource().getLocation();
        try { return PathUtils.get(url.toURI()); }
        catch (URISyntaxException bogus) {
            throw new RuntimeException(bogus); }
        }

    XPackBuild(final String shortHash, final String date) {
            this.shortHash = shortHash;
            this.date = date;
            }

    public String shortHash() {
        return this.shortHash;
        }
    public String date(){
        return this.date;
        }

    static {
        final Path path = getElasticsearchCodebase();
        String shortHash = null;
        String date = null;
        Label_0157: { shortHash = "Unknown"; date = "Unknown";
    }

    CURRENT = new XPackBuild(shortHash, date);
    }
}
[root@hk-elk-elastic1 elk]# javac -cp "/usr/local/elk/elasticsearch-6.3.0/lib/elasticsearch-6.3.0.jar:/usr/local/elk/elasticsearch-6.3.0/lib/lucene-core-7.3.1.jar:/usr/local/elk/elasticsearch-6.3.0/modules/x-pack/x-pack-core/x-pack-core-6.3.0.jar" LicenseVerifier.java
[root@hk-elk-elastic1 elk]# javac -cp "/usr/local/elk/elasticsearch-6.3.0/lib/elasticsearch-6.3.0.jar:/usr/local/elk/elasticsearch-6.3.0/lib/lucene-core-7.3.1.jar:/usr/local/elk/elasticsearch-6.3.0/modules/x-pack/x-pack-core/x-pack-core-6.3.0.jar:/usr/local/elk/elasticsearch-6.3.0/lib/elasticsearch-core-6.3.0.jar"  XPackBuild.java
[root@hk-elk-elastic1 elk]# cp -a /usr/local/elk/elasticsearch-6.3.0/modules/x-pack/x-pack-core/x-pack-core-6.3.0.jar .
[root@hk-elk-elastic1 elk]# jar -xf x-pack-core-6.3.0.jar
[root@hk-elk-elastic1 elk]# rm -rf LicenseVerifier.java XPackBuild.java x-pack-core-6.3.0.jar
[root@hk-elk-elastic1 elk]# cp -a LicenseVerifier.class org/elasticsearch/license/
[root@hk-elk-elastic1 elk]# cp -a XPackBuild.class org/elasticsearch/xpack/core/
[root@hk-elk-elastic1 elk]# rm -rf LicenseVerifier.class XPackBuild.class
[root@hk-elk-elastic1 elk]# jar -cvf x-pack-core-6.3.0.jar *
[root@hk-elk-elastic1 elk]# cp -a x-pack-core-6.3.0.jar  /usr/local/elk/elasticsearch-6.3.0/modules/x-pack/x-pack-core/

[root@hk-elk-elastic1 elk]# vim /usr/local/elk/elasticsearch-6.3.0/config/elasticsearch.yml
xpack.security.enabled: false    #关闭x-pack安全验证(3台master都需要操作)
2、重启elasticsearch服务,并上传license.json
[root@hk-elk-elastic1 config]# cat /root/license.json
{"license":{"uid":"2e44e23c-7087-447b-9a0e-398b8b7a917c","type":"platinum","issue_date_in_millis":1532649600000,"expiry_date_in_millis":2544271999999,"max_nodes":100,"issued_to":"han jiang (www.zfcloud.com)","issuer":"Web Form","signature":"AAAAAwAAAA2elPtByKMPXHGshznoAAABmC9ZN0hjZDBGYnVyRXpCOW5Bb3FjZDAxOWpSbTVoMVZwUzRxVk1PSmkxaktJRVl5MUYvUWh3bHZVUTllbXNPbzBUemtnbWpBbmlWRmRZb25KNFlBR2x0TXc2K2p1Y1VtMG1UQU9TRGZVSGRwaEJGUjE3bXd3LzRqZ05iLzRteWFNekdxRGpIYlFwYkJiNUs0U1hTVlJKNVlXekMrSlVUdFIvV0FNeWdOYnlESDc3MWhlY3hSQmdKSjJ2ZTcvYlBFOHhPQlV3ZHdDQ0tHcG5uOElCaDJ4K1hob29xSG85N0kvTWV3THhlQk9NL01VMFRjNDZpZEVXeUtUMXIyMlIveFpJUkk2WUdveEZaME9XWitGUi9WNTZVQW1FMG1DenhZU0ZmeXlZakVEMjZFT2NvOWxpZGlqVmlHNC8rWVVUYzMwRGVySHpIdURzKzFiRDl4TmM1TUp2VTBOUlJZUlAyV0ZVL2kvVk10L0NsbXNFYVZwT3NSU082dFNNa2prQ0ZsclZ4NTltbU1CVE5lR09Bck93V2J1Y3c9PQAAAQCDbfLHMEJ/Bp4sIDNuTFk9IyxaUaxxxs3/EjU7urcHaU8X9tlxUICA2g4vnIcJ/nPcsZKxfq+j3wriz0DGtL0c4At2tzMEEuIdi1J7hLUxJz1GzQYCfaV84mIHeSeBObaTJF7ic03ef0t8kMztMk17/7/+mJWacqk9GES/wAQfaLzGxxX38sj6rpSG/jMlve7EIFHiGb22jGp8NDGuneooddESvrUth5lrm3tDTPWtM5Vf/RvTUJy4LX3PJsqrgZscx0n0cbXtjDHU4SAyvZ02govNAeZZFMKgmGXnLqpWXJGX3GOeN4I2xxky03NR4mPtPogsoA7EDALcIXFe+wr4","start_date_in_millis":1532649600000}}

[root@hk-elk-elastic1 elk]# curl -XPUT -u elastic:chageme 'http://10.20.11.205:9200/_xpack/license' -H "Content-Type: application/json" -d @license.json    #(3台master全部需要执行)
{"acknowledged":true,"license_status":"valid"}
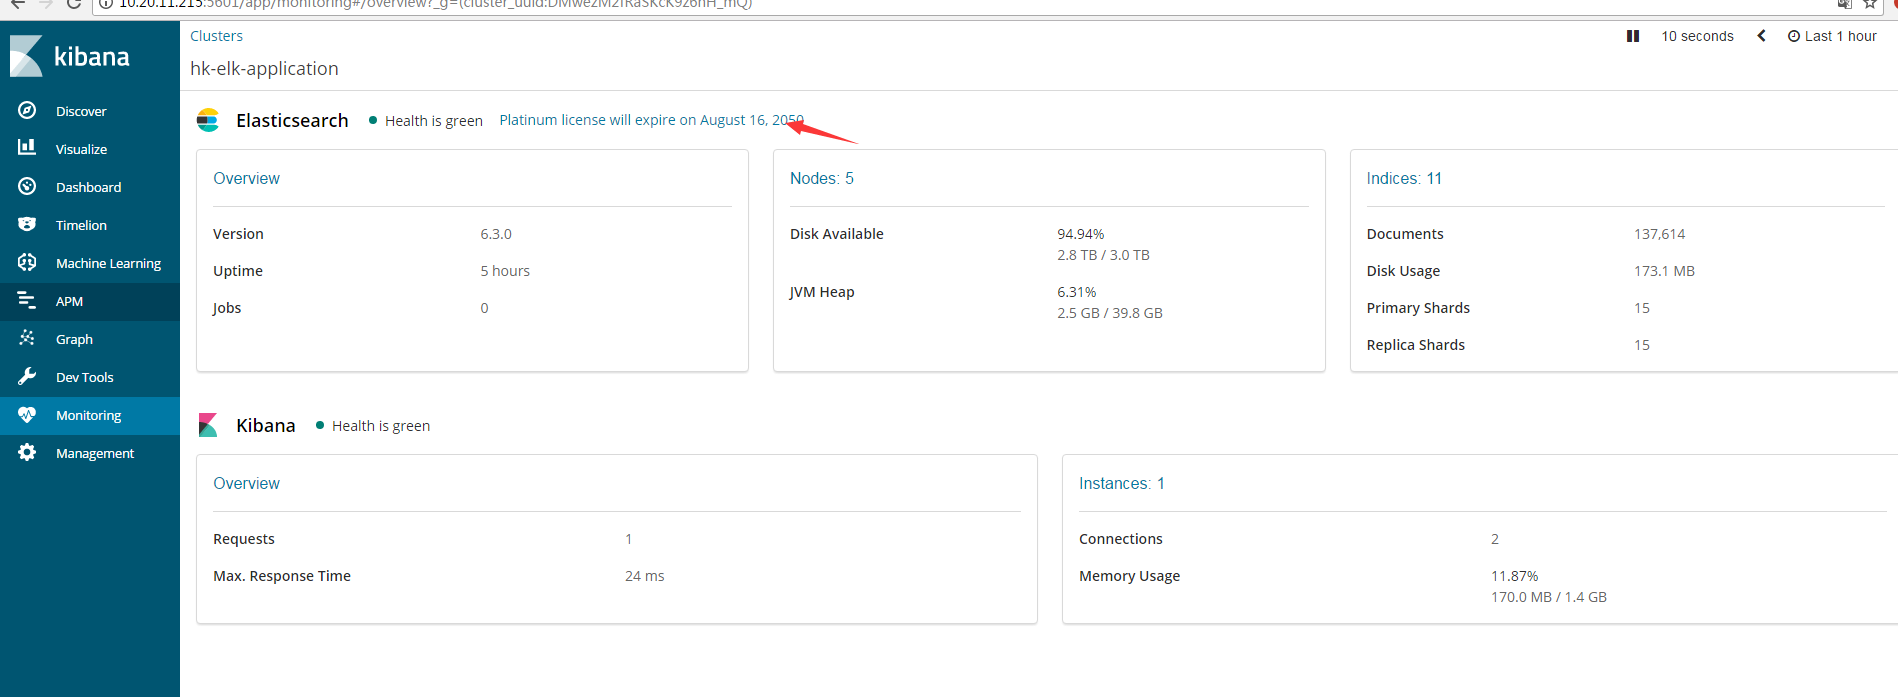
看到这说明破解成功,但是6.0以上的版本需要强制开始ssl传输,所以我们需要配置SSL。
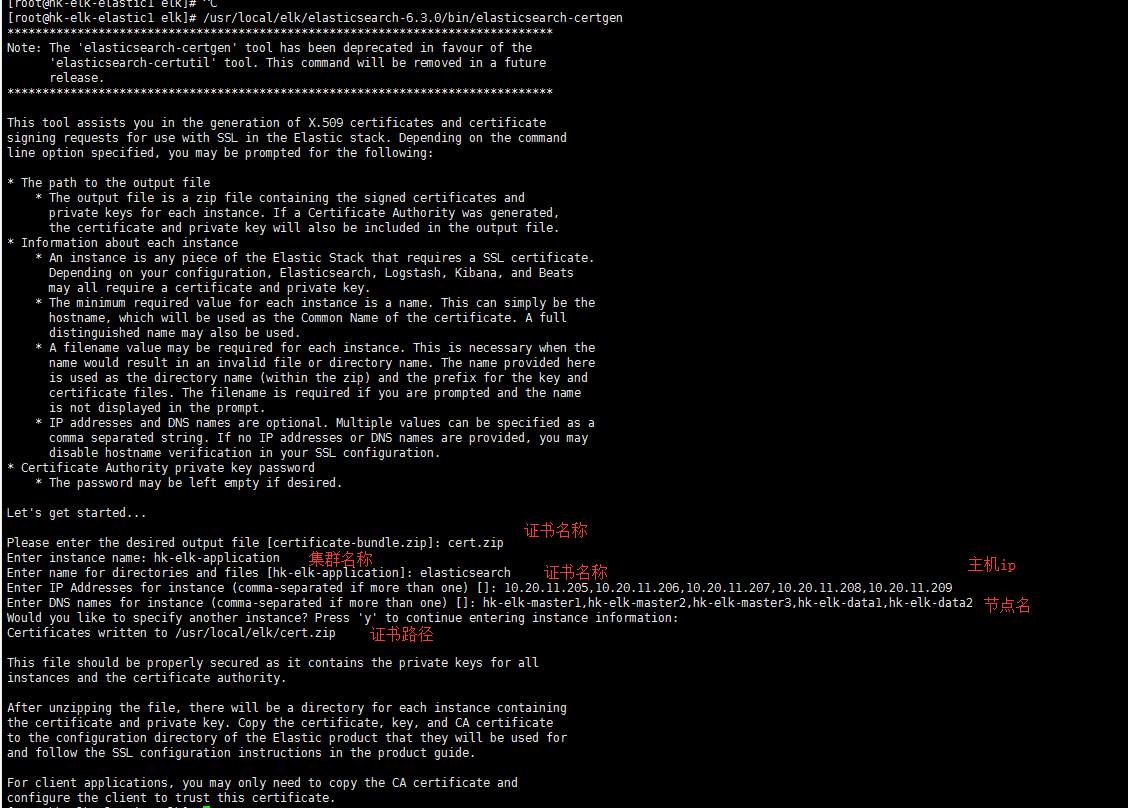
五*、配置SSL并启动x-pack*
1、创建证书
2、解压以及配置证书,拷贝到其他主机(master and data)
[root@hk-elk-elastic1 elk]# mkdir /tmp/cert
[root@hk-elk-elastic1 elk]# mv cert.zip /tmp/cert/
[root@hk-elk-elastic1 elk]# cd /tmp/cert/<br>[root@hk-elk-elastic1 elk]# unzip cert.zip
Archive:  cert.zip
   creating: ca/
  inflating: ca/ca.crt
  inflating: ca/ca.key
   creating: elasticsearch/
  inflating: elasticsearch/elasticsearch.crt
  inflating: elasticsearch/elasticsearch.key
[root@hk-elk-elastic1 elk]# ll
总用量 8
drwxrwxr-x 2 elastic elastic   34 9月  20 13:47 ca
-rw------- 1 elastic elastic 5157 9月  20 13:47 cert.zip
drwxrwxr-x 2 elastic elastic   56 9月  20 13:47 elasticsearch
[root@hk-elk-elastic1 elk]# mv ca/* /usr/local/elasticsearch/config/
[root@hk-elk-elastic1 elk]# mv elasticsearch/*  /usr/local/elasticsearch/config/
[root@hk-elk-elastic1 elk]# cd /usr/local/elasticsearch/config/
[root@hk-elk-elastic1 elk]# ll -rct  #最后四个
总用量 48
-rw-rw---- 1 elastic elastic    0 9月  19 16:15 users_roles
-rw-rw---- 1 elastic elastic    0 9月  19 16:15 users
-rw-rw---- 1 elastic elastic  197 9月  19 16:15 roles.yml
-rw-rw---- 1 elastic elastic  473 9月  19 16:15 role_mapping.yml
-rw-rw---- 1 elastic elastic 6380 9月  19 16:15 log4j2.properties
-rw-rw---- 1 elastic elastic 2942 9月  19 16:15 jvm.options
-rw-r----- 1 elastic elastic 2853 9月  19 16:15 elasticsearch.yml-bak
-rw-rw---- 1 elastic elastic  207 9月  19 16:20 elasticsearch.keystore
-rw-rw---- 1 elastic elastic 2905 9月  20 13:27 elasticsearch.yml
-rw-rw-r-- 1 elastic elastic 1671 9月  20 13:57 ca.key
-rw-rw-r-- 1 elastic elastic 1200 9月  20 13:57 ca.crt
-rw-rw-r-- 1 elastic elastic 1675 9月  20 13:57 elasticsearch.key
-rw-rw-r-- 1 elastic elastic 1237 9月  20 13:57 elasticsearch.crt

[root@hk-elk-elastic1 elk]# scp -pr *.crt root@10.20.11.[206--209]:/usr/local/elk/elasticsearch-6.3.0/config/
[root@hk-elk-elastic1 elk]# scp -pr *.crt root@10.20.11.[206--209]:/usr/local/elk/elasticsearch-6.3.0/config/
3、配置SSL,其他节点相同
[root@hk-elk-elastic1 elk]# grep "^[a-z]" /usr/local/elk/elasticsearch-6.3.0/config/elasticsearch.yml
cluster.name: hk-elk-application
node.name: hk-elk-master1
node.master: true
node.data: false
path.data: /data
path.logs: /data/log
network.host: 10.20.11.205
http.port: 9200
transport.tcp.port: 9300
discovery.zen.ping.unicast.hosts: ["10.20.11.205:9300","10.20.11.206:9300","10.20.11.207:9300"]
discovery.zen.minimum_master_nodes: 2
discovery.zen.ping_timeout: 60s
xpack.security.enabled: true  #之前为false,现在需要打开
xpack.security.transport.ssl.enabled: true
xpack.ssl.key: elasticsearch.key  #路径需要自己写清楚
xpack.ssl.certificate: elasticsearch.crt
xpack.ssl.certificate_authorities: ca.crt
4、重启elasticsearch服务
我们需要配置kabana的用户密码
5、创建elk集群相关的用户密码
[root@hk-elk-elastic1 elk]# ./elasticsearch-setup-passwords -h  #查看命令帮助
Sets the passwords for reserved users

Commands
--------
auto - Uses randomly generated passwords          #主要命令选项,表示系统将使用随机字符串设置密码
interactive - Uses passwords entered by a user    #主要命令选项,表示使用用户输入的字符串作为密码

Non-option arguments:
command

Option         Description
------         -----------
-h, --help     show help
-s, --silent   show minimal output
-v, --verbose  show verbose output
root@hk-elk-elastic1 elk]# ./elasticsearch-setup-passwords auto  #为了演示效果,这里我们使用系统自动创建
Initiating the setup of passwords for reserved users elastic,kibana,logstash_system,beats_system.
The passwords will be randomly generated and printed to the console.
Please confirm that you would like to continue [y/N]y     #选择y


Changed password for user kibana                   #kibana角色和密码
PASSWORD kibana = SY8ubxQWUdFieDJNlJt6

Changed password for user logstash_system          #logstash角色和密码
PASSWORD logstash_system = h9MkqxtCfJYRBx3NTruQ

Changed password for user beats_system             #beast角色和密码
PASSWORD beats_system = KEPbjSJuSuXGWMsSAvxx

Changed password for user elastic                  #elasticsearch角色和密码
PASSWORD elastic = kijObt6nZkY9KU4CwJkn

#用户密码先保存下来。
kibana配置elasticsearch用户认证
[root@hk-elk-kibana elk]# grep "^elastic" /usr/local/elk/kibana-6.3.0-linux-x86_64/config/kibana.yml
elasticsearch.url: "http://10.20.11.205:9200"
elasticsearch.username: "elastic"
elasticsearch.password: "kijObt6nZkY9KU4CwJkn"
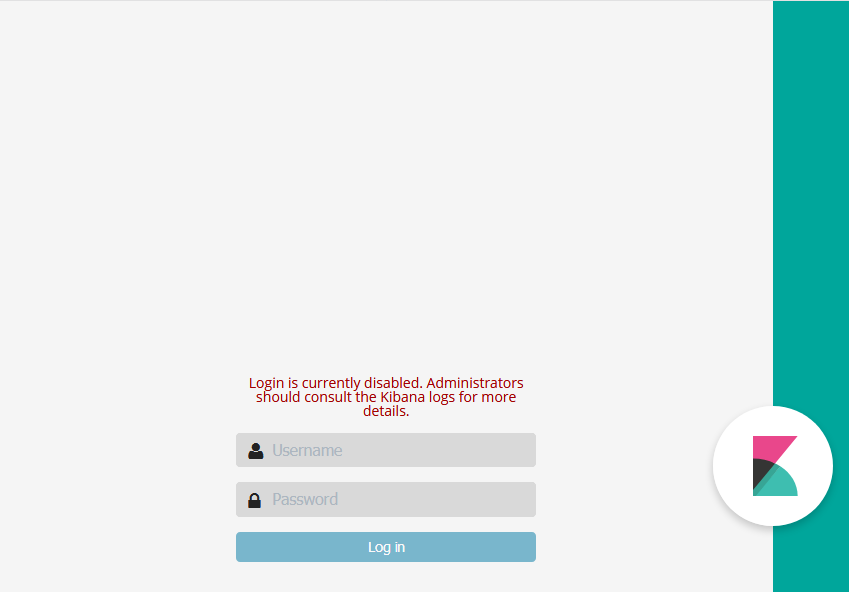
重启kibana,打开界面
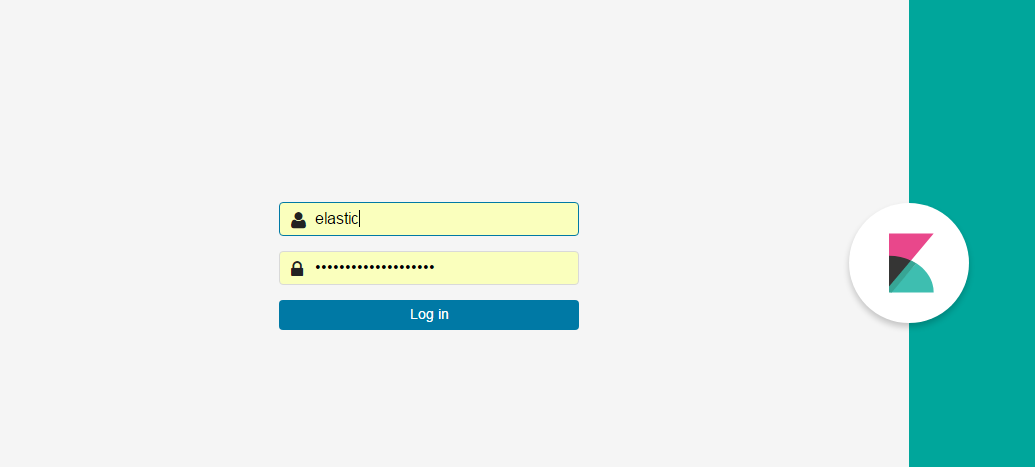
##在这里我们选择用elastic用户登入,刚踩的坑,如果用kibana用户登入,里面索引的数据会看不到
六*、配置nginx日志,并配置logstash*
1、配置nginx日志格式。
[root@cc conf]# vim /usr/local/tengine/conf/nginx.conf  #配置elk的日志格式
log_format  ELK  '$remote_addr > ($hostname)$server_addr:$server_port - $remote_user [$time_local] $http_host "$request" '
                 '$status $body_bytes_sent "$http_referer" $upstream_status $upstream_addr $request_time $upstream_response_time '
                 '"$http_user_agent" "$http_x_forwarded_for"';

[root@cc conf]# vim /usr/local/tengine/conf/conf.d/test.conf  #配置使用ELK格式生成nginx日志
access_log /home/nginx/nginx.log ELK;
2、搭建使用filebeat插件,将nginx日志发送到redis。
[root@cc~]# cd /usr/local/elk
[root@cc local]# tar -xf filebeat-6.3.1-linux-x86_64.tar.gz
[root@cc local]# cat filebeat-6.3.1-linux-x86_64/filebeat.yml | grep -v "#"

[root@cc local]# cat filebeat-6.3.1-linux-x86_64/filebeat.yml | grep -v "#"
filebeat.inputs:
- type: log
  enabled: true
  paths:
    - '/home/nginx/*.log'
  tags: ["nginxlog"]
  document_type: nginxlog
  tail_files: true

output.redis:
  hosts: ["10.20.11.200:6379","10.20.11.200:6379","10.20.11.202:6379"]
  db: 2   #redis数据库的一个整数索引标识,redis不同于mysql有一个库的名字。redis总共0-15默认16个库。
  timeout: 5   #连接超时时间
  key: "default_list"  #以default_list的keys传输到redis
3、搭建配置logstash。
[root@hk-elk-logstash1 elk]# cd /usr/local/elk/
[root@hk-elk-logstash1 elk]# tar -xf logstash-6.3.0.tar.gz
[root@hk-elk-logstash1 elk]# vim /usr/local/elk/logstash-6.3.0/customconf/patterns/custompatterns #自定义一些正则,因为有些字段可能会匹配不到
URIPARM1 [A-Za-z0-9$.+!*'|(){},~@#%&/=:;^\\_<>`?\-\[\]]*
URIPATH1 (?:/[\\A-Za-z0-9$.+!*'(){},~:;=@#% \[\]_<>^\-&?]*)+
HOSTNAME1 \b(?:[0-9A-Za-z_\-][0-9A-Za-z-_\-]{0,62})(?:\.(?:[0-9A-Za-z_\-][0-9A-Za-z-:\-_]{0,62}))*(\.?|\b)
STATUS ([0-9.]{0,3}[, ]{0,2})+
HOSTPORT1 (%{IPV4}:%{POSINT}[, ]{0,2})+
FORWORD (?:%{IPV4}[,]?[ ]?)+|%{WORD}
STATUS2 ([0-9]+(?:\.[0-9A-Fa-f]+))
STATUS1 (([0-9]+(?:\.[0-9A-Fa-f]+))[, ]{0,3})+
NUMBER1 ([0-9][, ]{0,2})+
WORD1 \w+
#--------------------------------waf-------------------------------
WAFTIMES (%{DAY} %{MONTH} %{MONTHDAY} %{TIME} CST %{YEAR})
#--------------------------------ossec------------------------------
ALERTTIME %{YEAR} %{SYSLOGTIMESTAMP}
[root@hk-elk-logstash1 elk]# vim conf/logstash_nginx.conf
input{
redis{
host => "10.20.11.200"
port => 6379
key => "default_list"
data_type => "list"
threads => 2
batch_count => 500
type => "nginxlog"
}
redis{
host => "10.20.11.201"
port => 6379
key => "default_list"
data_type => "list"
threads => 2
batch_count => 500
type => "nginxlog"
}
redis{
host => "10.20.11.202"
port => 6379
key => "default_list"
data_type => "list"
threads => 2
batch_count => 500
type => "nginxlog"
}
}
filter {
if [type]=="nginxlog"{
grok {
patterns_dir => "/usr/local/elk/logstash-6.3.0/customconf/patterns"
#match => ["message", "%{IPORHOST:srcip} > \(%{HOSTNAME1:hostname}\)%{IPORHOST:dstip}(?::%{POSINT:dstport}) - (%{USERNAME:user}|-) \[%{HTTPDATE:requesttime}\] (%{HOSTNAME1:domain}|-) \"(?:%{WORD:requestmethod} %{URIPATH:url}(?:%{URIPARAM:params})?(?: HTTP/%
{NUMBER:httpversion})?|%{DATA:rawrequest})\" %{NUMBER:response} (?:%{NUMBER:bytes:int}|-) \"(?:%{DATA:httpreferrer}|-)\" (%{STATUS:upstreamstatus}|-) (?:%{HOSTPORT1:upstreamaddr}|-) (%{BASE16FLOAT:upstreamresponsetime}|-) (%{STATUS:responsetime}|-) \"%{DATA:agent}\" \"(
%{FORWORD:x_forword_for}|-)\""]
match => ["message", "%{IPORHOST:srcip} > \(%{HOSTNAME1:hostname}\)%{IPORHOST:dstip}(?::%{POSINT:dstport}) - (%{USERNAME:user}|-) \[%{HTTPDATE:requesttime}\] (%{HOSTNAME1:domain}|-) \"(?:%{WORD:requestmethod} %{URIPATH:url}(?:%{URIPARAM:params})?(?: HTTP/%{NU
MBER:httpversion})?|%{DATA:rawrequest})\" %{NUMBER:response} (?:%{NUMBER:bytes:int}|-) \"(?:%{DATA:httpreferrer}|-)\" (%{NUMBER1:upstreamstatus}|-) (?:%{HOSTPORT1:upstreamaddr}|-|%{WORD1})(%{WORD1}){0,1} (%{STATUS1:upstreamresponsetime}|-) (%{STATUS2:responsetime}|-) \"
%{DATA:agent}\" \"(%{FORWORD:x_forword_for}|-)\""]
}
date {
match => ["requesttime", "dd/MMM/yyyy:HH:mm:ss Z"]
}
}
}
output{
elasticsearch {
hosts => ["10.20.11.205:9200","10.20.11.206:9200","10.20.11.207:9200"]
index => "logstash-%{type}-%{+YYYY.MM}"
document_type => "%{type}"
flush_size => 20000
idle_flush_time => 10
sniffing => true
template_overwrite => true
user => elastic
password => kijObt6nZkY9KU4CwJkn
}
}
[root@hk-elk-logstash1 elk]# cat /root/logstash.sh #启动脚本
#!/bin/bash
/usr/local/elk/logstash-6.3.0/bin/logstash -f /usr/local/elk/conf/logstash_nginx.conf > /dev/null 2>&1 &
[root@hk-elk-kibana elk]# curl -u elastic:kijObt6nZkY9KU4CwJkn http://10.20.11.205:9200/_cat/indices?v #查看生成的索引
health status index uuid pri rep docs.count docs.deleted store.size pri.store.size
green open .kibana gU4UBd4TR1mAA-aECYpn0g 1 1 2 0 21.8kb 10.9kb
green open .triggered_watches SgEPUJpGQQGNaoWzYt58Xw 1 1 0 0 891.1kb 439.7kb
green open .monitoring-es-6-2018.10.29 dVVc-OGmQvqn8m1DHhQrwQ 1 1 58062 12 54.1mb 27mb
green open .monitoring-es-6-2018.10.31 xxqkwEMZS8OFZ7qbjEVXPg 1 1 29072 36 35.1mb 17.5mb
green open .monitoring-kibana-6-2018.10.29 J2XYE2SRQh2IMv37beL1tg 1 1 5257 0 2.7mb 1.3mb
green open .security-6 d0eHXJ53TY2LZLtdYbw-FA 1 1 6 0 43.9kb 21.9kb
green open .monitoring-kibana-6-2018.10.31 4xL0Hg5VQuCLPx1Pv9Kejw 1 1 1311 0 757.1kb 371.4kb
green open .watcher-history-7-2018.10.31 g5pNSZyzQGa7OQnNDUKcTw 1 1 1328 0 3.7mb 1.9mb
green open logstash-nginxlog-2018.10 otPefpY2SB-91e9SEJFlEw 5 1 622 0 916.4kb 432.2kb
green open .monitoring-es-6-2018.10.30 Nn2z9G7zRMWn64QzWkKj_g 1 1 143285 180 160.6mb 80.2mb
green open .watches nWHsiQKlRL-MWGtDVrsiLA 1 1 6 0 101.5kb 50.7kb
green open .watcher-history-7-2018.10.30 Knx0vwdcSmutrIxMeNUdlw 1 1 5831 0 16.6mb 8.3mb
green open .monitoring-kibana-6-2018.10.30 aLv88r9lST-WVRGb8t82MA 1 1 8208 0 4.2mb 2.1mb
green open .monitoring-alerts-6 DdteUg1_TR2DuPCdfnIqnA 1 1 1 0 12.3kb 6.1kb
java应用使用
input{
         redis{
                        host => "10.20.11.200"
                        port => 6379
                        key => "logstash_csp"
                        data_type => "list"
                        threads => 1
                        #batch_count => 500
        }
         redis{
                        host => "10.20.11.201"
                        port => 6379
                        key => "logstash_csp"
                        data_type => "list"
                        threads => 1
                        #batch_count => 500
        }
         redis{
                        host => "10.20.11.202"
                        port => 6379
                        key => "logstash_csp"
                        data_type => "list"
                        threads => 1
                        #batch_count => 500
        }

}


output{
        elasticsearch {
                hosts => ["10.20.11.205:9200","10.20.11.206:9200","10.20.11.207:9200"]
                index => "logstash-%{appAlias}-%{+YYYY.MM}"
                user =>  elastic
                password => kijObt6nZkY9KU4CwJkn
        }
}

[root@hk-elk-logstash1 elk]# cat /root/logstash.sh
启动脚本
#!/bin/bash
/usr/local/elk/logstash_csp/bin/logstash -f /usr/local/elk/conf/logstash_csp.conf > /dev/null 2>&1 &
sleep 5


/usr/local/elk/logstash_tss/bin/logstash -f /usr/local/elk/conf/logstash_tss.conf > /dev/null 2>&1 &
sleep 5


/usr/local/elk/logstash_gateway/bin/logstash -f /usr/local/elk/conf/logstash_gateway.conf > /dev/null 2>&1 &
sleep 5


/usr/local/elk/logstash_source/bin/logstash -f /usr/local/elk/conf/logstash_source.conf > /dev/null 2>&1 &
sleep 5


/usr/local/elk/logstash_fk/bin/logstash -f /usr/local/elk/conf/logstash_fk.conf > /dev/null 2>&1 &
sleep 5
针对日志目录比较多,可使用
input {
file {
type => "nginx_access"
path => [ "/var/log/nginx/json/www.aa_access.log" ]
add_field => ["website", "www.aa.com"] ##过滤可以使用website或者是appl来过滤分析数据
add_field => ["appl", "aa"]
}
file {
type => "nginx_access"
path => [ "/var/log/nginx/json/www.bb_access.log" ]
add_field => ["website", "www.bb.com"]
add_field => ["appl", "bb"]
}
filter {
if [type] == "nginx_access" {
grok {
patterns_dir => "/usr/local/elk/logstash-6.3.0/customconf/patterns"
match => ["message", "%{IPORHOST:srcip} > \(%{HOSTNAME1:hostname}\)%{IPORHOST:dstip}(?::%{POSINT:dstport}) - (%{USERNAME:user}|-) \[%{HTTPDATE:requesttime}\] (%{HOSTNAME1:domain}|-) \"(?:%{WORD:requestmethod} %{URIPATH:url}(?:%{URIPARAM:params})?(?: HTTP/%{NUMBER:httpversion})?|%{DATA:rawrequest})\" %{NUMBER:response} (?:%{NUMBER:bytes:int}|-) \"(?:%{DATA:httpreferrer}|-)\" (%{NUMBER1:upstreamstatus}|-) (?:%{HOSTPORT1:upstreamaddr}|-|%{WORD1})(%{WORD1}){0,1} (%{STATUS1:upstreamresponsetime}|-) (%{STATUS2:responsetime}|-) \"%{DATA:agent}\" \"(%{FORWORD:x_forword_for}|-)\""]
}
date {
match => [ "requesttime" , "dd/MMM/YYYY:HH:mm:ss Z" ]
}
}
mutate{
convert => ["responsetime","float"] ##将responsetime转换为float类型,方便图表分析,默认为string类型
convert => ["upstreamresponsetime","float"]
}
}
output {
elasticsearch {
hosts => ["10.20.11.205:9200","10.20.11.206:9200","10.20.11.207:9200"]
index => "logstash-%{type}-%{+YYYY.MM.dd}"
document_type => "%{type}"
user => "elastic"
password => "kijObt6nZkY9KU4CwJkn"
}
}
启动
nohup ./bin/logstash -f ./conf.d -l logs &
相关正则调试工具
ELK的手册
https://kibana.logstash.es/content/logstash/

在Elasticsearch查看索引索引名称:
curl 'localhost:9200/_cat/indices?v'
查看所有文档内容:
curl -i -XGET http://localhost:9200/_search?pretty
查询指定索引下的文档
curl -i -XGET http://localhost:9200/索引名称/_search?pretty
删除索引:
curl -XDELETE 'http://127.0.0.1:9200/索引名称'
查看文档总数:
curl -XGET 'http://localhost:9200/_count?pretty' -d '
{
    "query": {
        "match_all": {}
    }
}'
查看映射:
curl -i -XGET 'http://localhost:9200/logstash-nginxlog-2017.05.10/_mapping/nginxlog?pretty'
logstash-nginxlog-2017.05.10索引名称
nginxlog 索引类型

地图数据库下载地址:http://dev.maxmind.com/geoip/geoip2/geolite2/
备注:使用MaxMind DB

Kibana地图汉化:
http://www.jianshu.com/p/07b82092d4af
具体配置:
# vim /usr/local/ELK/kibana-5.4.1-linux-x86_64/config/kibana.yml
添加最后添加,
tilemap.url: 'http://webrd02.is.autonavi.com/appmaptile?lang=zh_cn&size=1&scale=1&style=7&x={x}&y={y}&z={z}'
注意:加载地图需要时间,不会立刻显示汉化后的地图。

正则测试器
http://grokdebug.herokuapp.com/
http://grok.qiexun.net/  ##国内源,访问速度比较快

https://regexper.com
正则表达式:
https://github.com/elastic/logstash/blob/v1.4.2/patterns/grok-patterns
https://github.com/logstash-plugins/logstash-patterns-core/tree/master/patterns
4、kibana添加索引
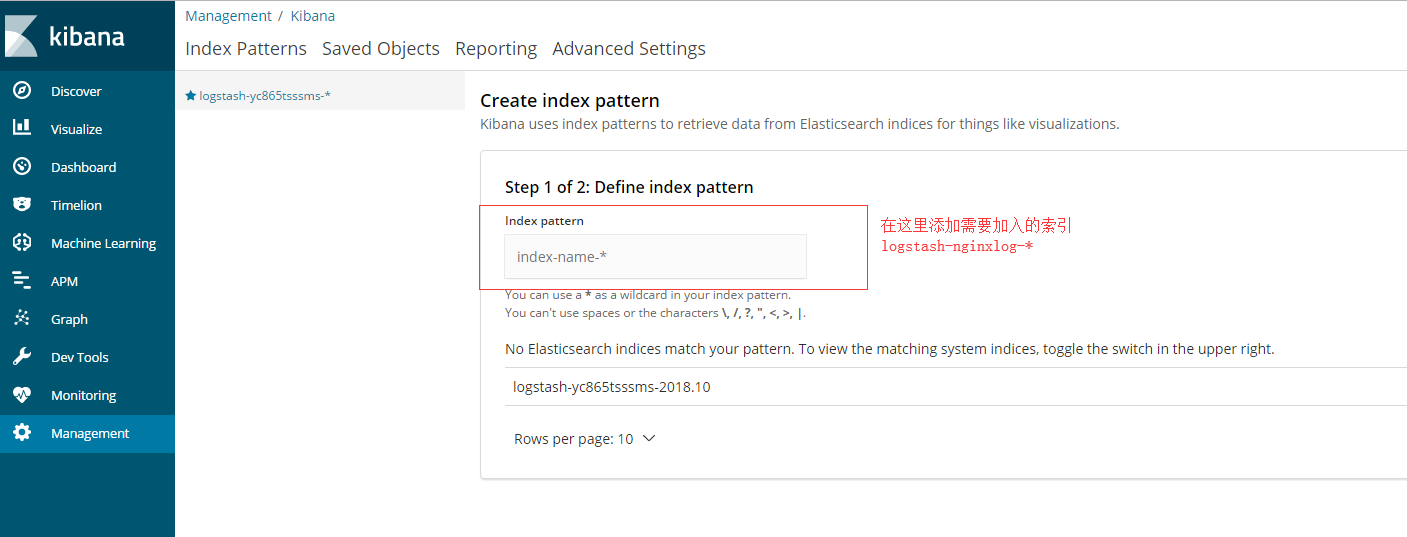
Discover里面可以查看到相应的日志信息,可使用相应的字段过滤搜索。
关于分片的两个问题
1) “我应该有多少个分片?”
答: 每个节点的分片数量保持在低于每1GB堆内存对应集群的分片在20-25之间。
2) “我的分片应该有多大”?
答:分片大小为50GB通常被界定为适用于各种用例的限制。
文章转载请说明出处:八零岁月 » elk集群配置并破解x-pack
评论前必须登录!